
Lab Stats
Additional lab stats will be shown here, such as the precision and accuracy of primary and secondary standards, the oldest date possible (as determined by blank analysis) and maybe some statistic that represents our success rate (number of samples that we were unable to date).
Turnaround Time Chart
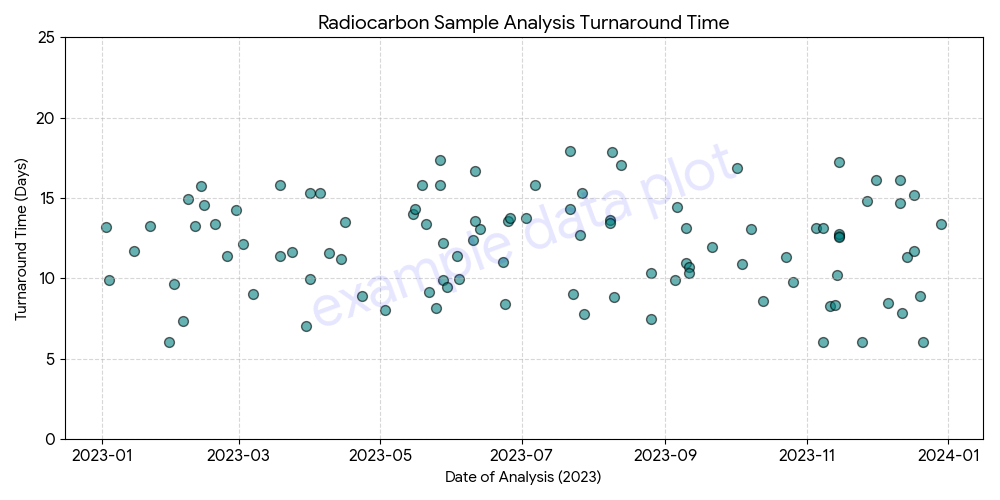
This is a placeholder for a chart that shows the turnaround time. The chart will be automatically updated daily so that it reflects the real time status of the lab in terms of the time taken from sample receipt until the results reported.
HOxII Primary Standard Analysis Over Time
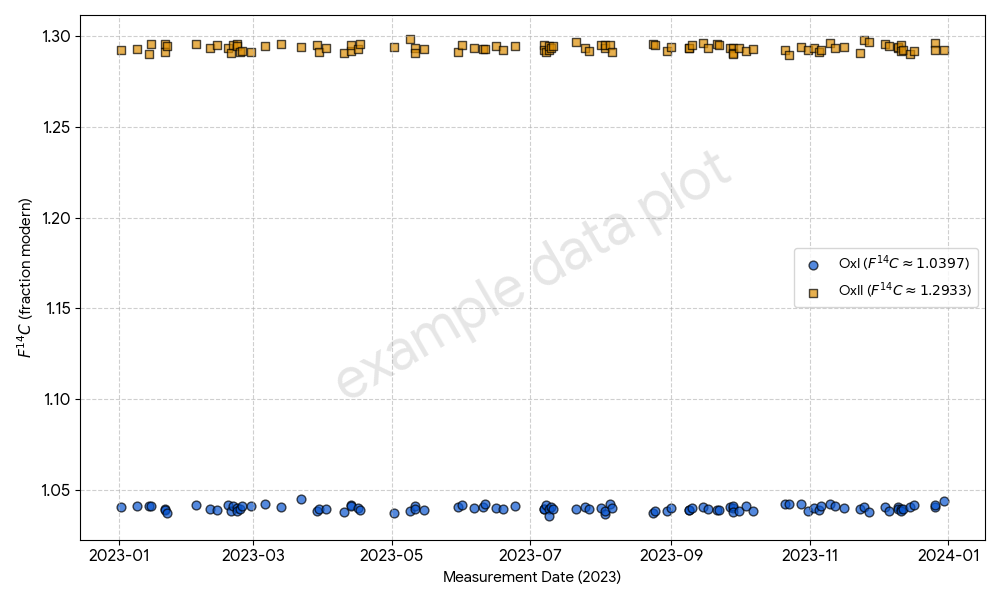
This is a basic example placeholder for one of several charts that show the results obtained from repeat analysis of primary and secondary standards and blanks. The charts will be automatically updated daily so that they reflect the real time data quality.
Here, there will be a link to an R-based dashboard that will provide a suite of high-resolution plots of all data collected to date – that includes all metrics as well as analysis data. The emphasis here is to be able to use these hi-res plots to monitor the quality of our processes and our instruments. Many of the metrics collected during the preparation and analysis of samples provide valuable information regarding the state of the processes and equipment, often showing tell-tale signs of degradation that can be rectified and reversed before there’s a significant impact on overall data quality.
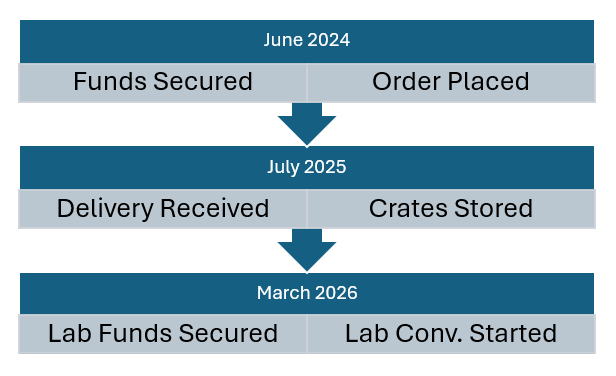
Instrument Installation